


.png?Status=Master&sfvrsn=4c04cf13_1)
.png?Status=Master&sfvrsn=d5947d95_1)
.png?Status=Master&sfvrsn=2b1efdd1_1)
For most of the last decade, owning a home was about motion. You bought a starter place, built some equity, traded up, and did it again. Moving was the plan.
Then the plan stalled. Millions of homeowners are holding mortgages priced well below today's rates, and for them, selling means giving up a cheap loan for an expensive one. While the market has spent years describing these owners as "stuck," the data clearly supports a different interpretation: when relocating stops making sense, home improvement takes its place.
The Great American Nesting Index, constructed by 3 Day Blinds, ranks all 50 states and Washington, D.C., on how firmly homeowners are settling in and reinvesting in the homes they already have. New York tops the list, with the entire top five sitting in the Northeast.
The pattern splits the country in two. Where owners stay for decades and equity climbs, nesting runs hot. Where people arrived recently and haven't put down roots yet, it runs cooler. The index makes that divide easy to see, state by state.
Key Findings
- The top five states are all Northeastern: New York, Connecticut, New Jersey, Pennsylvania, and Massachusetts.
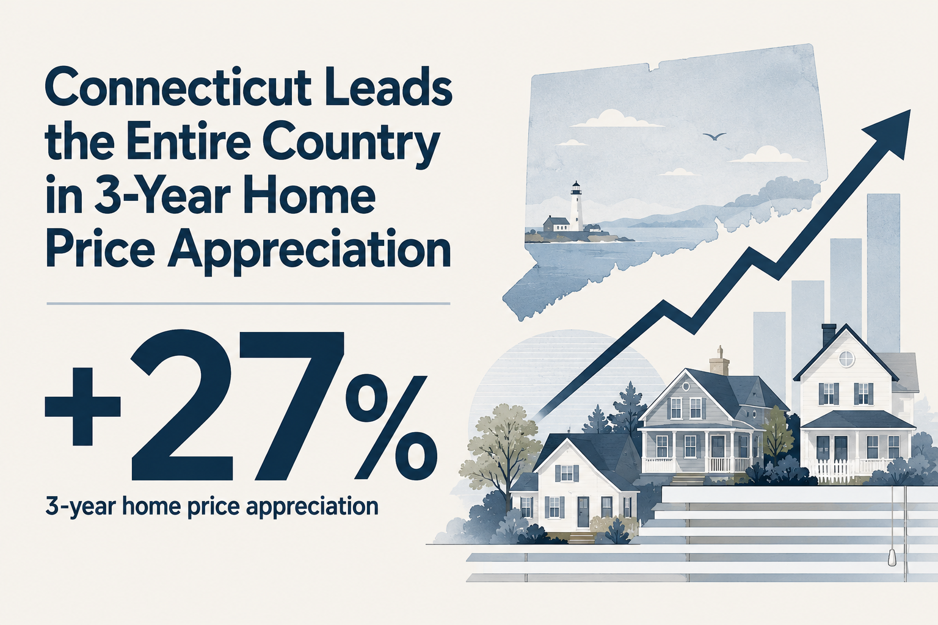
- Connecticut leads the country in three-year home price appreciation at +27.0%, just ahead of New Jersey at +26.9%.
- New York and West Virginia tie for the nation's highest long-tenure share at 60.5%, meaning three in five owners moved in before 2010.
- Pennsylvania ranks third for long tenure at 59.8%, on more than 2.17 million households in place 14 years or longer.
- Nevada ranks last (#51) with the lowest long-tenure share at 38.1%, fewer than four in ten owners settled before 2010.
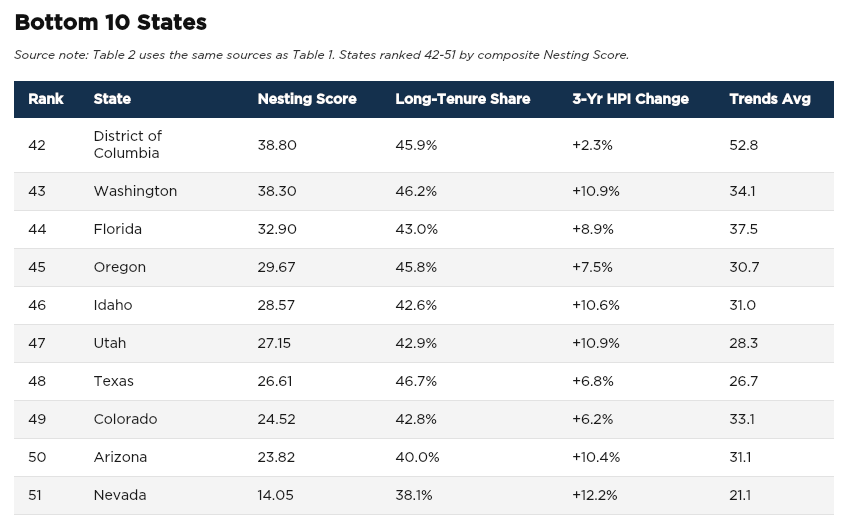
- The bottom five (Nevada, Arizona, Colorado, Texas, Utah) are Sun Belt and Mountain West states that absorbed heavy pandemic-era migration.
- Kansas ranks seventh, powered by the highest home-improvement search interest in the study.
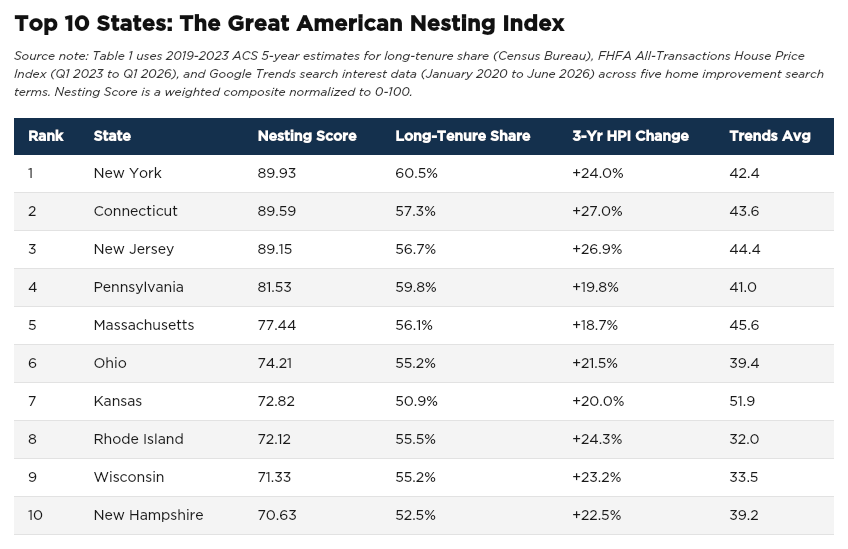
Source: U.S. Census Bureau ACS 5-Year Estimates Table B25038 | FHFA House Price Index All-Transactions, hpi_at_state.txt | Google Trends, Interest by Subregion
The Northeast is Where Homeowners Stay for Decades
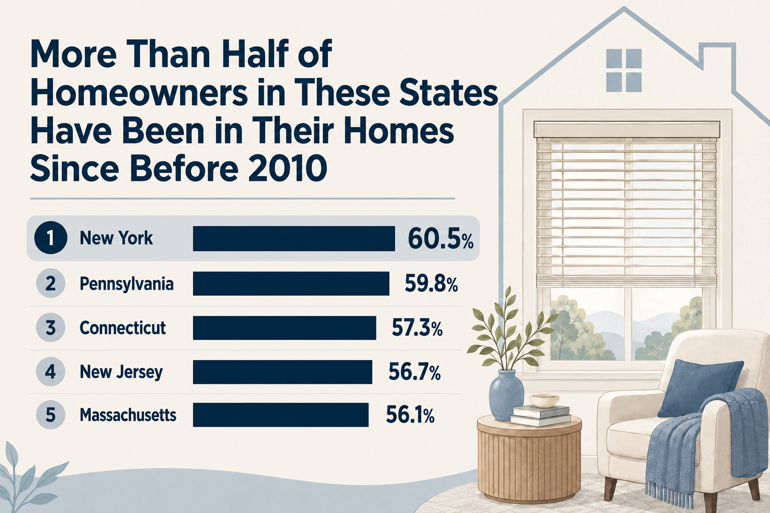
New York, Connecticut, New Jersey, Pennsylvania, and Massachusetts take the top five spots in that order. These are five separate housing markets with different price points and economies, and they still land together, which suggests the behavior underneath is regional rather than coincidental.
In these states, more than half of all homeowners have been in their houses since before 2010:
- New York: 60.5%
- Pennsylvania: 59.8%
- Connecticut: 57.3%
- New Jersey: 56.7%
- Massachusetts: 56.1%
Part of what keeps the region rooted is who owns the homes. According to the National Association of Home Builders, homeowners aged 65 and older hold more than a third of owner-occupied housing units nationally, and the long-predicted wave of older owners downsizing has largely stalled. The math backs the choice. Many own their homes outright, and with the cost of private senior living climbing, staying home is simply the sensible call.
That choice compounds in a region built on some of the country's oldest housing stock. When older owners stay, existing homes rarely change hands, first-time buyers find little to choose from, and the homes that do come up for sale often need real work before they suit a modern buyer. The result is a tight-supply loop that keeps long-tenured owners right where they are, and turns their attention toward improving the homes they have no plans to leave.
Connecticut: Equity That Rewards Staying
New Jersey: The State That Checks Every Box
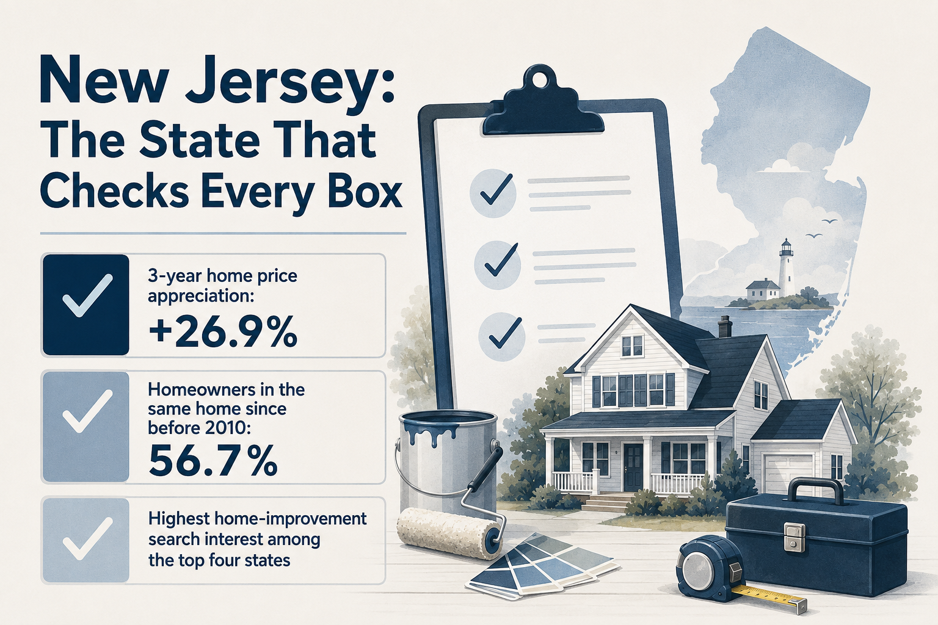
New Jersey ranks third in the Nesting Index, serving as a clear snapshot of the stay-and-improve pattern. While it does not top any single category, it performs consistently across all of them.
- New Jersey’s three-year home price appreciation is +26.9%.
- Over half of owner-occupied households (56.7%) have remained in their homes since before 2010.
- Home-improvement search interest is the highest among the top four states, signaling a strong local trend of active property investment.
Statewide market data reinforces this behavior. As of May 2026, Redfin reports that New Jersey home prices rose 3.3% year-over-year to a median of $563,000. With inventory levels holding at just three months of supply, the market remains tight and low-turnover, discouraging listing activity and prompting owners to reinvest in their current properties rather than trade up.
Pennsylvania's Quiet Depth
Pennsylvania ranks fourth, and it gets there on rootedness rather than flash. Its 59.8% long-tenure share is the third-highest in the country, and behind that percentage sits real scale: more than 2.17 million owner-occupied households have stayed in place for 14 years or longer. That's a vast base of owners with little reason to move and a growing reason to improve.
Pennsylvania's appreciation is gentler than its neighbors', at +19.8%, and that's the whole point. Its story is about staying, not sudden windfall. This is a state full of people who bought, stayed, and kept staying. The urge to nest here doesn't come from a jump in home value. It comes from putting down roots and building on them.
Source: U.S. Census Bureau ACS 5-Year Estimates Table B25038 | FHFA House Price Index All-Transactions, hpi_at_state.txt | Google Trends, Interest by Subregion
The Sun Belt Hasn't Settled Down Yet
Now turn the map over. The five lowest-ranked states are Nevada (#51), Arizona (#50), Colorado (#49), Texas (#48), and Utah (#47). Every one is a Sun Belt or Mountain West destination that took in a wave of new residents during the pandemic years.
The reason is straightforward. When a state welcomes large numbers of recent arrivals, its average tenure drops, because so many owners just got there. Nevada's long-tenure share is the lowest in the country at 38.1%, so fewer than four in ten owners moved in before 2010. Arizona sits at 40.0%, Colorado at 42.8%, Utah at 42.9%, Texas at 46.7%. These are homeowners still finding their footing, still unpacking, not yet at the point where a house becomes a long-term project instead of a recent purchase.
Census net migration data shows just how much these states absorbed. Texas led the nation in sheer volume, gaining hundreds of thousands of domestic movers a year between 2020 and 2023. Arizona and Nevada drew heavy inflows from California, and Utah and Colorado saw a rush tied to the recreation economy and tech relocation that tightened suburban and rural supply alike.
None of this makes these markets weak. It makes them young in tenure terms. Nesting tends to follow settling, and much of the Sun Belt simply hasn't settled long enough yet.
The Kansas Outlier: Why Nesting Is Accelerating Here
Kansas ranks seventh in the Nesting Index, and it is a distinct outlier. While the national remodeling market faces a "downshift," Kansas is bucking the trend. Homeowners here are actively reinvesting in their properties. It posts the highest home improvement search interest of any state in the index, across terms like home remodel, interior design, and living room makeover.
The driver is a powerful combination of affordability and sudden wealth.
First, the barrier to entry is lower. The median home price in Kansas sits well below the national average, freeing up significant room in the average household budget that would otherwise be eaten up by a massive down payment. Second, there is a surge in local wealth. According to the Bureau of Economic Analysis (BEA), Kansas led the nation in the third quarter of 2025 with current-dollar GDP growth of 6.5% and personal income growth of 6.3%.
When you pair that increased disposable income with tighter inventory in metros like Kansas City and Wichita, the result is clear: homeowners are choosing to improve the assets they already own. The reason to nest in Kansas is an affordable market with rising paychecks, and it shows up clearly in the search data.
Washington, D.C.: The Exception That Proves the Rule
One entry breaks every pattern in the index. Washington, D.C., posted just +2.3% home price appreciation over three years, nearly 25 percentage points below Connecticut. It's a reminder that the capital's housing market runs on its own logic, shaped by federal employment and a rental-heavy, high-turnover population that looks nothing like the rooted Northeast around it.
The capital is caught between two forces. Return-to-office mandates have brought federal workers back to their desks, lifting Metro ridership to approximately 80% of pre-pandemic levels. At the same time, federal employment in the Washington region contracted by more than 62,000 jobs between January 2025 and January 2026, and office vacancy rates across the metro area now hover around 22%.
Even so, home prices have held up, propped up by a near-total freeze on new residential construction under tight financing. D.C. is nesting for reasons that have nothing to do with the rest of the map. Not deep roots and rising equity, but a supply-and-policy squeeze unique to the federal city.
Summary
The lock-in effect has mostly been told as a story of constraint, of homeowners boxed in by the math of their own mortgages. The Nesting Index looks at what those homeowners are doing with the situation instead. When moving is off the table, attention turns to the rooms you already have, to the kitchen you've cooked in for years and the custom window treatments you've been meaning to update.
The map that emerges is really a map of putting down roots. The Northeast leads because its owners have stayed the longest and gained the most, and staying is where nesting starts. The Sun Belt trails not because anything's wrong there, but because so many of its owners are still new. Give it time. Roots take a while, and then people start to build on them.
There's something quietly hopeful in that. A generation that expected to keep moving is learning the value of staying, and turning the place they're in into the place they want to be.
Methodology
The Great American Nesting Index ranks all 50 states and the District of Columbia on how firmly homeowners are committing to their current homes rather than moving. The index draws on three public data sources rather than a survey.
Long-term tenure comes from the U.S. Census Bureau's American Community Survey 2019–2023 Five-Year Estimates (Table B25038), measured as the share of owner-occupied households that moved into their current home before 2010 (14 or more years of tenure). Home price appreciation comes from the Federal Housing Finance Agency's All-Transactions House Price Index, measured over three years from Q1 2023 to Q1 2026. Home-improvement interest comes from Google Trends, averaged across five search terms (home refresh, home remodel, interior redesign, window treatments, and living room makeover) for the period January 2020 through June 2026, with values winsorized at the 95th percentile to limit the effect of outliers.
Each component was normalized to a 0–100 scale and weighted to produce a final Nesting Score: tenure 40%, appreciation 35%, and search interest 25%. Rankings reflect the combined weighted score. The index is a screening tool for where the stay-and-improve pattern is strongest, not a definitive measure of any individual homeowner's plans.
Fair Use Policy
Users are welcome to utilize the insights and findings from this study for noncommercial purposes, such as academic research, educational presentations, and personal reference. When referencing or citing this article, please ensure proper attribution to maintain the integrity of the research. Direct linking to this article is permissible, and access to the original source of information is encouraged.
For commercial use or publication purposes, including but not limited to media outlets, websites, and promotional materials, please contact the authors for permission and licensing details. We appreciate your respect for intellectual property rights and adherence to ethical citation practices. Thank you for your interest in our research.